North Tyneside Overview of health and wellbeing

Related indicators

Related indicators which impact life expectancy and healthy expectancy

The indicators below are known drivers of life expectancy and healthy life expectancy and provide some insight into possible key areas which determine these outcomes. There will be separate JSNA topics to understand these indictors in detail.

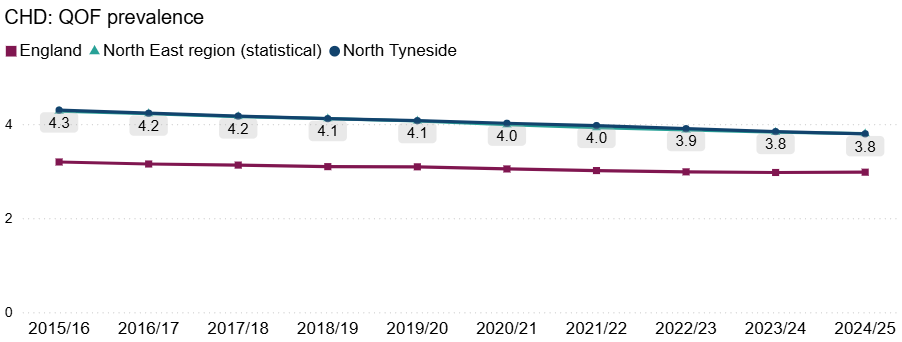
Coronary heart disease (CHD)

In North Tyneside, the prevalence of heart disease is 3.9%, the same as the North East average, both are above the England average of 3.0%

Line chart showing CHD QOF prevalence from 2015/16 to 2024/25 for England, the North East region, and North Tyneside. Rates decrease steadily across the period, with England consistently lowest and North Tyneside similar to North East averages.

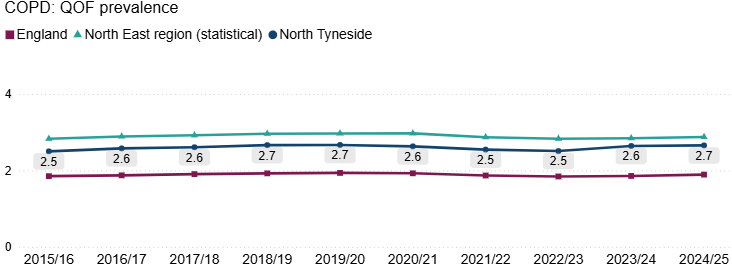
Respiratory disease – Chronic Obstructive Pulmonary Disease (COPD)

In North Tyneside, the prevalence of COPD is 2.5% compared with 2.8% in the North East and 1.8% in England.

Line chart showing COPD QOF prevalence from 2015/16 to 2024/25 for England, the North East region, and North Tyneside. Rates are lowest in England throughout the period, while the North East and North Tyneside have higher and broadly stable prevalence.

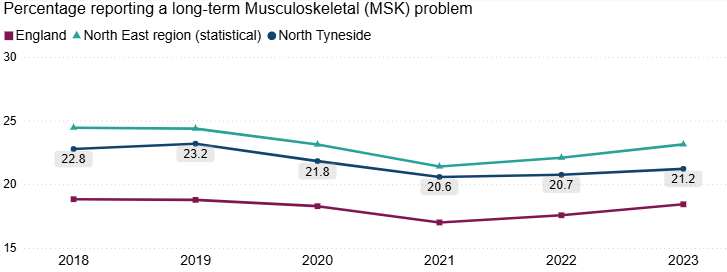
Musculo skeletal (MSK) conditions

In North Tyneside the prevalence of MSK is 21.2%. The North East is 23.1% and England is 18.4%.

Line chart showing the percentage of people reporting a long‑term musculoskeletal (MSK) problem from 2018 to 2023 for England, the North East region, and North Tyneside. Levels are consistently lowest in England, higher in the North East and North Tyneside, with a dip in 2021 followed by a modest increase.

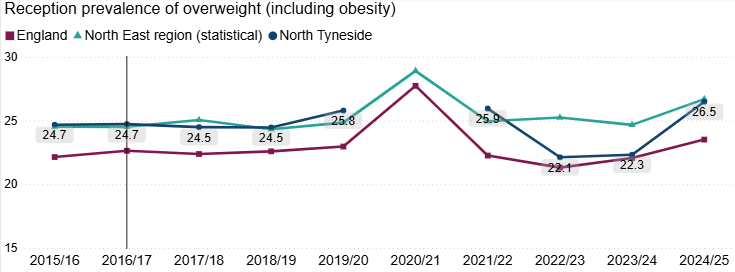
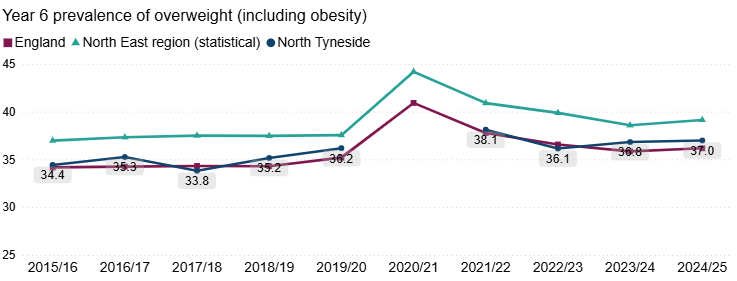
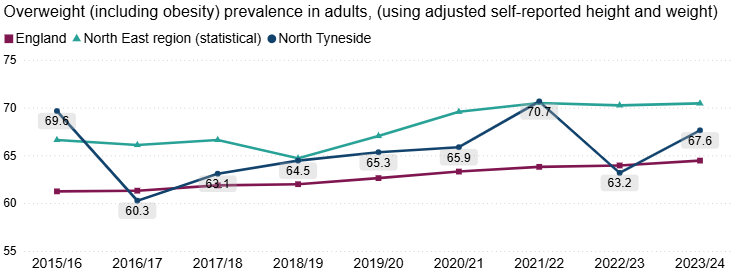
Overweight and obesity

In North Tyneside, the prevalence of excess weight (overweight and obese) in Reception is 22.1%, below the North East average of 25.2% and England average of 21.3%.

Line chart showing Reception prevalence of overweight (including obesity) from 2015/16 to 2024/25 for England, the North East region, and North Tyneside. All areas show a sharp increase in 2020/21, followed by lower but persistently higher levels in the North East and North Tyneside compared with England.

In North Tyneside, the prevalence of excess weight (overweight and obese) in Year 6 is 36.1%, below the North East average of 39.9% and England average of 36.6%.

Line chart of Year 6 prevalence of overweight (including obesity) from 2015/16 to 2024/25 comparing England, the North East region, and North Tyneside. Prevalence peaks in 2020/21 and remains higher in the North East and North Tyneside than the England average

In North Tyneside, the prevalence of obese adults is 70.7%, above the North East average of 70.5% and England average of 63.8%.

Line chart of adult overweight (including obesity) prevalence from 2015/16 to 2023/24 comparing England, the North East region, and North Tyneside. Prevalence is higher in the North East and North Tyneside than England across most years.

Smoking prevalence

In North Tyneside, smoking prevalence is 11.2% compared to 13.1% in the North East and 12.7% in England.

Line chart showing smoking prevalence among adults aged 18 and over (current smokers, APS) from 2015 to 2024 for England, the North East region, and North Tyneside. All areas show a sustained downward trend, with the North East and North Tyneside generally above the England average.

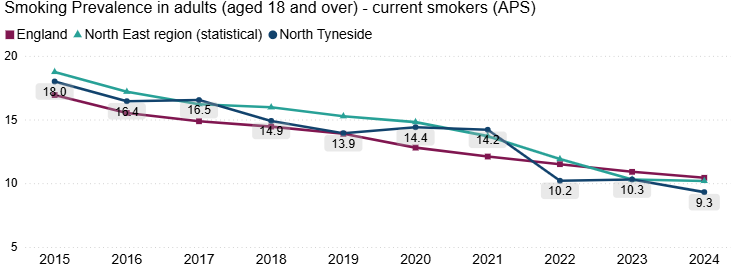
All of above charts were sourced from OHID Fingertips in January 2026

Resident median full time weekly earnings

The weekly earnings in North Tyneside are £652.40 compared to the national average of £682.60 and the North East average of £613.70.
(Source: NOMIS March 2024 Earnings by place of residence (2023))