
Inequalities in life expectancy
Health inequalities are avoidable, unfair and systematic differences in health between different groups of people.
Males
The gap in life expectancy in the borough is 12.3 years for males.
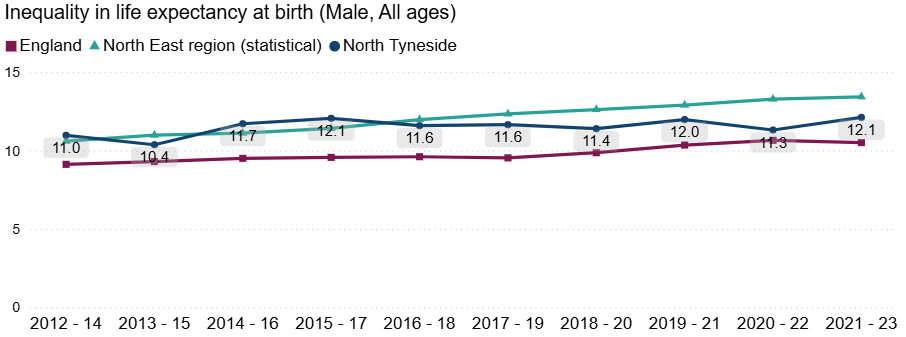
Source: OHID Fingertips January 2026
This has remained stable since 2014-16. The gap is lower than the average for the NE (the largest gaps are found in all Tees authorities Stockton on Tees is the largest of all at 14.5 years) and the gap is larger than that for Newcastle and Northumberland.
20.4% of the gap due to deaths from heart disease and stroke, followed by deaths from injury, poisoning or suicide.
Females
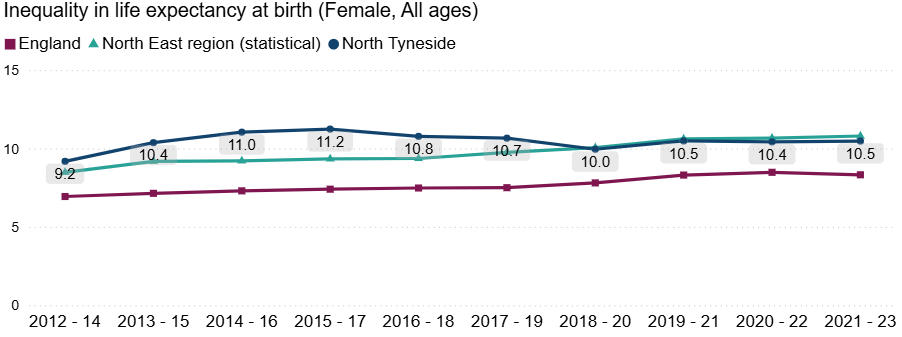
The gap is 9.9 years for females lowest since 2015-17 when it was 11.2 years. Similar to the NE value (10 years) and similar to Northumberland. Stockton has the biggest gap (13.9 years).
The largest contributors are deaths from heart disease and stroke, cancer and COPD.
What conditions contribute to this gap?
Higher mortality rates (causes of death) in more deprived areas from heart disease, lung cancer, and chronic lower respiratory diseases account for around a third of the total gap in life expectancy for both sexes.
Smoking and obesity are the main risk factors for these diseases.
Although smoking prevalence in England has declined, people in the more deprived areas are still more likely to smoke than people in the least deprived areas.