
3. Network Planning for Cycling
3.1 Establishing cycling infrastructure improvements
The North Tyneside network of Strategic Cycle Routes, as shown in Appendix A, serves as the ‘Primary’ desire line network in the LCWIP – these represent routes likely to carry high cycling flows and which link large residential areas to trip attractors such as a town centre or business park. It is intended that these will act as the most direct and convenient routes for everyday cycling between key destinations.
As specified in the North Tyneside Cycling Strategy, these strategic routes will be supported by a grid of local cycling and walking routes with the aim that everyone is within 250m of a cycle route. These would form the ‘Secondary’ and ‘Local’ desire line routes when aligned to the LCWIP hierarchy definitions. The work undertaken for the LCWIP focuses on the ‘Primary’ network of Strategic Cycling Routes shown on the ‘tube map’.
As part of the LCWIP process, each of the Strategic Cycling Routes identified in the ‘tube map’, including the National Cycle Routes, was recorded and examined using the Route Selection Tool (RST), with specific attention to current and proposed:
- directness
- gradient
- safety
- connectivity
- comfort
- critical junctions
Routes were divided into sections and each section had a Route Selection Tool document created for it. These documents were then used to compile an overall, comparable set of information for each route, proposals for infrastructure improvements, and anticipated impact.
This enabled recommendations to be prioritised, as well as ensuring that proposals meet design specifications.
3.2 Last Mile
Once the Strategic Cycle Network had been investigated, the focus turned to the links from those routes into the borough’s town centres. This piece of work, referred to as ‘Last Mile’ analysis, covered Wallsend, Whitley Bay and Killingworth town centres; North Shields was not investigated as part of the last mile exercise as improvements have already been designed and consulted upon for its links to the strategic cycle network as part of the North Shields Masterplan.
Analysis of the routes took the same form as the Strategic Cycle Network and it is anticipated that the last mile routes would be linked to their surrounding routes in terms of prioritisation.
| Town centre | Route Code | Road(s) |
Route connections |
||
|---|---|---|---|---|---|
| From | To | ||||
| Whitley Bay | WB1 | Hillheads Rd (A191) | Blue or Yellow | Red | |
| Wallsend | W1 | Station Road (A186) | Green | Orange | |
| W2 | Kings Road South | Green | Orange | ||
| W3 | Park Road | NCN72 | Orange | ||
| Killingworth | K1 | Killingworth Way (A1056) | Purple | Town centre (end destination) | |
| K2 | Northgate |
Purple NCN10 |
Town centre (end destination) | ||
Figure 3 - Whitley Bay Last Mile route
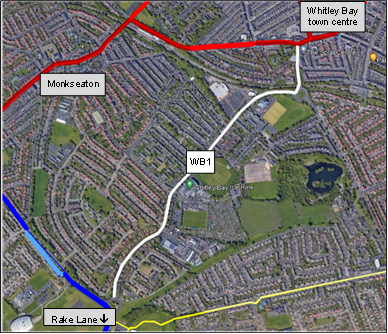
The route (WB1) identified for Whitley Bay town centre is A191 Hillheads Road. Potential cycling improvements to this section of the network would see a direct connection to the town centre from Foxhunters roundabout and connect the Blue or Yellow route with the Red route. Figure 3 shows the extents of the route.
Figure 4 - Wallsend Last Mile routes
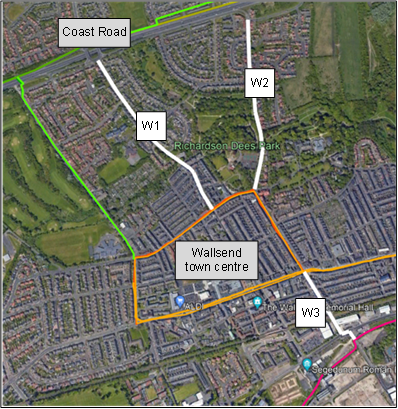
Wallsend Town centre has three last mile routes. The routes from the town centre to the north would connect the Green route with the Orange route via Station Road (W1) and Kings Road South (W2). Both routes would provide direct connections to the town centre from the Coast Road.
The route to the south would connect the Orange route with the NCN72. The route (W3) is located on Park Road.
Figure 5 - Killingworth Last Mile routes
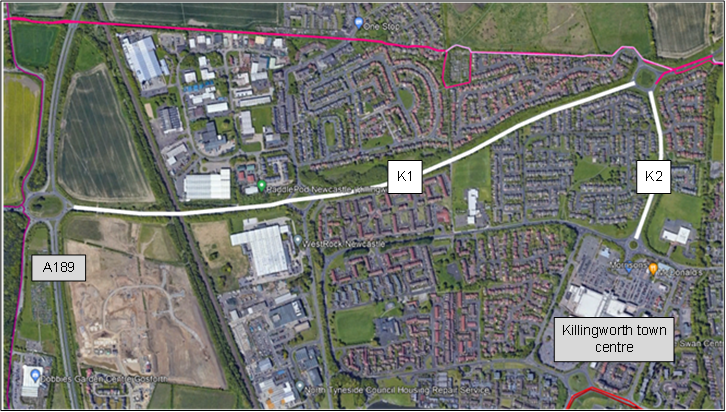
The last mile routes for Killingworth look to link the purple route and NCN10 with the town centre. K1 is located on A1056 and looks to connect Weetslade roundabout with Northgate. This will connect to route K2 which will direct users from A1056 to Killingworth town centre.
3.3 Cross Boundary Routes
The borough is bordered by two other authorities: Northumberland County Council to the north and Newcastle City Council to the west. The borough is also connected to South Tyneside Council via the Tyne Pedestrian and Cyclist Tunnels as well as the Shields Ferry.
North Tyneside’s strategic cycle network provides opportunities to improve connectivity between the neighbouring Authorities. Table 2 below shows the key cross boundary locations. The Authority will continue to work with neighbouring authorities to deliver the network and ensure route continuity.
Table 2 – Key cross boundary locations
| Connecting Authority | Route | NTC Identifier |
|---|---|---|
| Newcastle | A191 Front Street and A188 Benton Lane | Purple / Red |
| A1056 Sandy Lane | Purple / Black | |
| A1058 Coast Road | Green | |
| NCN 72 | Pink | |
| Northumberland | Dudley Lane, Dudley | Purple |
| NCN 1 – Coastal Route | Pink | |
| South Tyneside | NCN 72 | Pink |
3.4 Making recommendations
The data from the Route Selection Tool (RST) was utilised to score the individual sections of the routes in a transparent measure. The Authority will treat this as a live document which means any new routes can be considered and incorporated within the plan.
The routes were measured against the metrics shown in Figure 6 to determine a table of prioritisation. Tables 3 and 3a show the list of prioritised routes across the ‘tube map’ and last mile routes.
Table 6 - Metrics for cycling routes (based on Department for Transport guidance)
| Effectiveness |
Number of cycling trips Benefit Quality |
| Economic |
Cost Value for money |
| Deliverability | Constraints |
| Policy |
Link important destinations Grow the economy Improve safety Improve health and wellbeing Link to public transport Increase leisure and tourism Enable cycling to school |
Table 3 shows prioritisation based on DfT process. Other factors will affect the order in which sections of route will be delivered, e.g. new developments and regeneration plans; the availability of developer funding; and successful bids for external funding.
Table 3 - Cycle route section prioritisation
| Route code | Prioritised route | Total score | Ranking | Estimated cost |
|---|---|---|---|---|
Table 3a – Last mile prioritisation
| Route code | Prioritised route | Total score | Ranking | Estimated cost |
|---|---|---|---|---|